Team Sports
GPS vests track load. They don't track fitness.
Every professional team collects heart rate and speed from every session. But the analytics stop at distance, sprint counts, and training load. The physiological layer—aerobic capacity, endurance trends, fatigue signatures—is encoded in the same data but remains invisible. TrueZone makes it visible.
The Problem
External load tells you what happened. Not what it cost.
GPS tracking quantifies external load: total distance, high-speed running meters, sprint counts, accelerations. But the same external load produces vastly different internal responses across players. Without modeling the physiology, you cannot distinguish cruising from redlining.
Distance and speed are not load
Two players running 10 km at 8 kph average can have entirely different cardiac costs. The high-endurance player stays below threshold. The low-endurance player accumulates significant fatigue. The GPS data looks identical.
HR zones are still generic
Even when teams use heart rate data, zones are typically set from a generic %HRmax model or a single maximal test. They ignore endurance, which determines where thresholds actually fall and how quickly fatigue accumulates.
The Solution
Continuous physiological profiling from existing vest data.
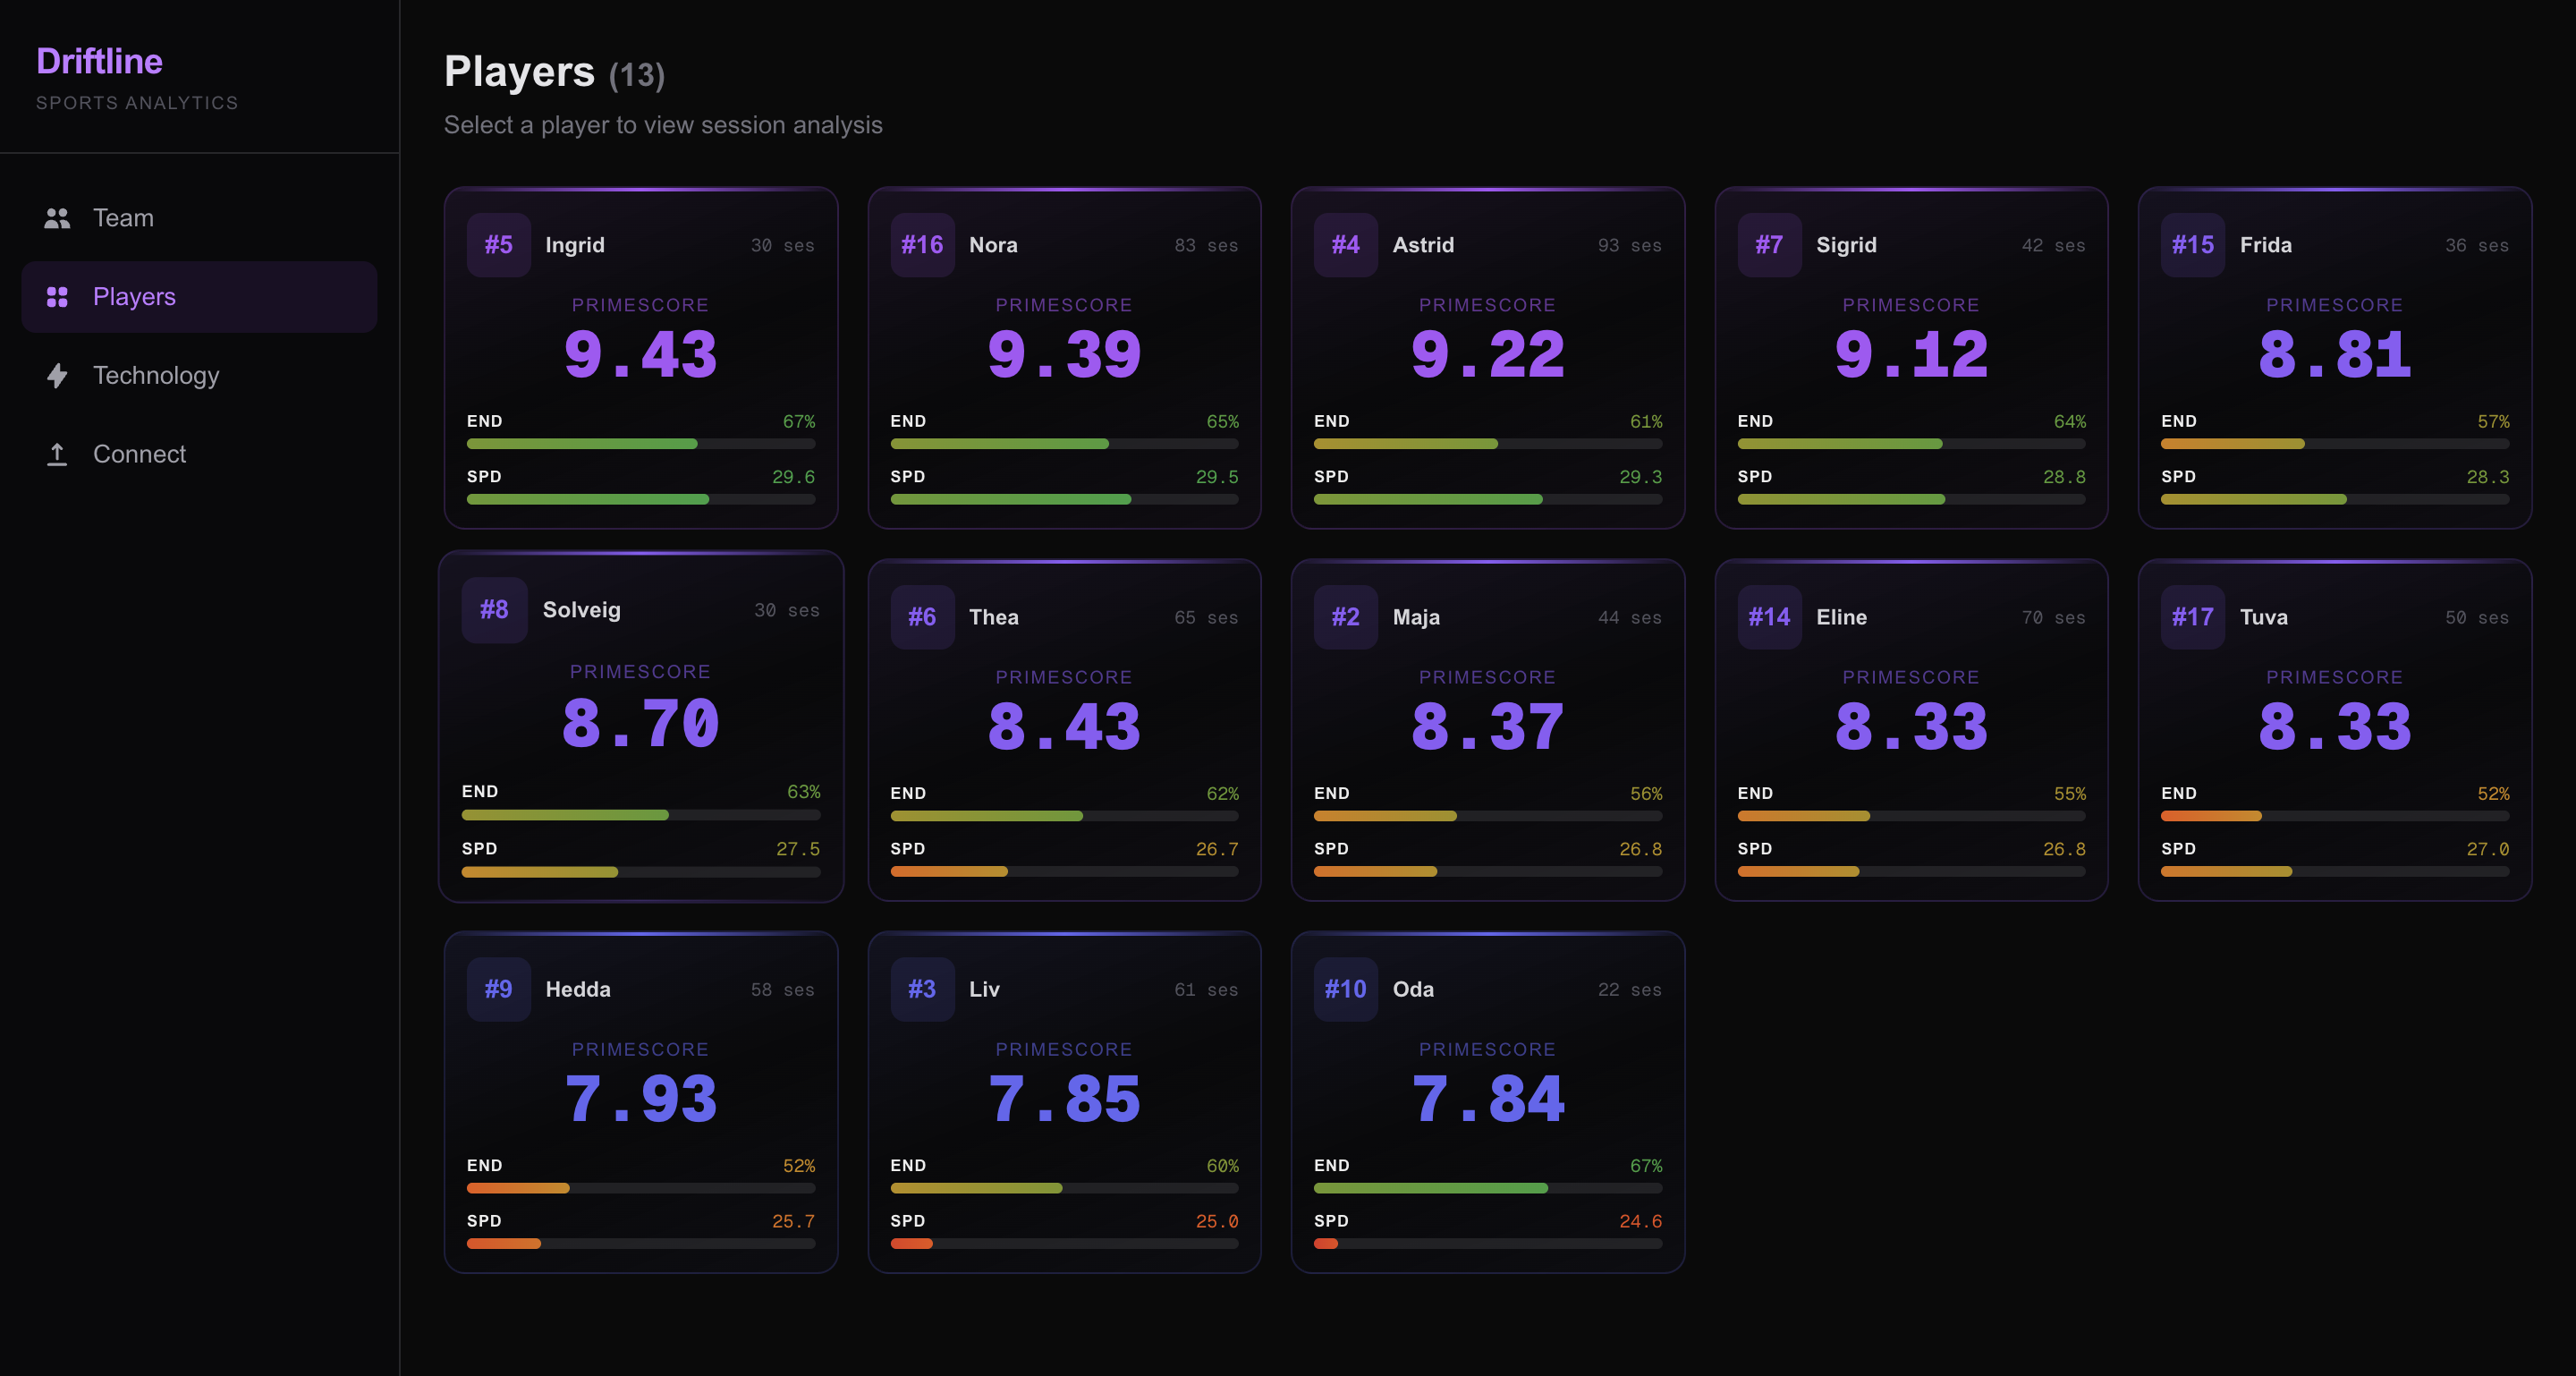
TrueZone extracts three parameters per player from standard GPS/HR data: endurance (E), maximum speed (Vmax), and HRmax (P). These reveal distinct player archetypes that are invisible to external-load metrics alone.
Speed-dominant
01Highest Vmax in the squad
High neuromuscular speed capacity relative to the team. These players reach the highest top speeds at the lowest cardiac cost, with their profile skewed toward sprint and high-speed running.
Endurance-dominant
02Highest E, lower Vmax
High aerobic endurance relative to speed. Lower cardiac drift, more sustainable repeated efforts, and higher fat oxidation during match play. Typical of central midfielders.
All-rounders
03Balanced E and Vmax
Balanced physiological profiles clustering near the squad mean. No single dominant quality, but no limitation either. Versatile across tactical roles and match phases.
Load-sensitive
04Lowest E in the squad
Low aerobic endurance relative to the team. These players accumulate fatigue fastest during sustained efforts and need the most careful workload management. Substitution timing, recovery protocols, and session load limits matter most for this group.
Applications
From profiling to decisions.
Physiological parameters become actionable when tracked longitudinally. Changes in endurance, cardiac drift, and PrimeScore over a season provide objective inputs for coaching decisions.
Pre-match squad selection
01Compare current endurance (E) and PrimeScore across the squad. Identify which players are in peak physiological condition and which are carrying accumulated fatigue.
Training periodisation
02Track training load against the fitness response it produces. The same session volume affects high-E and low-E players differently. Individualize prescription.
Return-to-play
03Monitor endurance (E) and confidence intervals as a player returns from injury or illness. Flag when parameters return to baseline rather than relying on subjective readiness.
Fatigue monitoring
04Cardiac drift trends flag under-recovery before subjective symptoms appear. Detect accumulated fatigue from match congestion, travel, or insufficient rest.
Validation
Six months with an elite women's football team.
13 players tracked from June to November 2020 using data from the SoccerMon dataset (Zenodo). 684 sessions covering 5,970 km of match and training data. An average of 53 sessions per player—sufficient for full parameter convergence and longitudinal tracking across a competitive season.
Study finding
The study demonstrated that TrueZone can extract stable, individualized physiological profiles from standard team GPS/HR vest data without any additional testing. Player archetypes emerged naturally from the three parameters, providing coaching staff with objective physiological context for load monitoring, squad selection, and return-to-play decisions.
Season Tracking
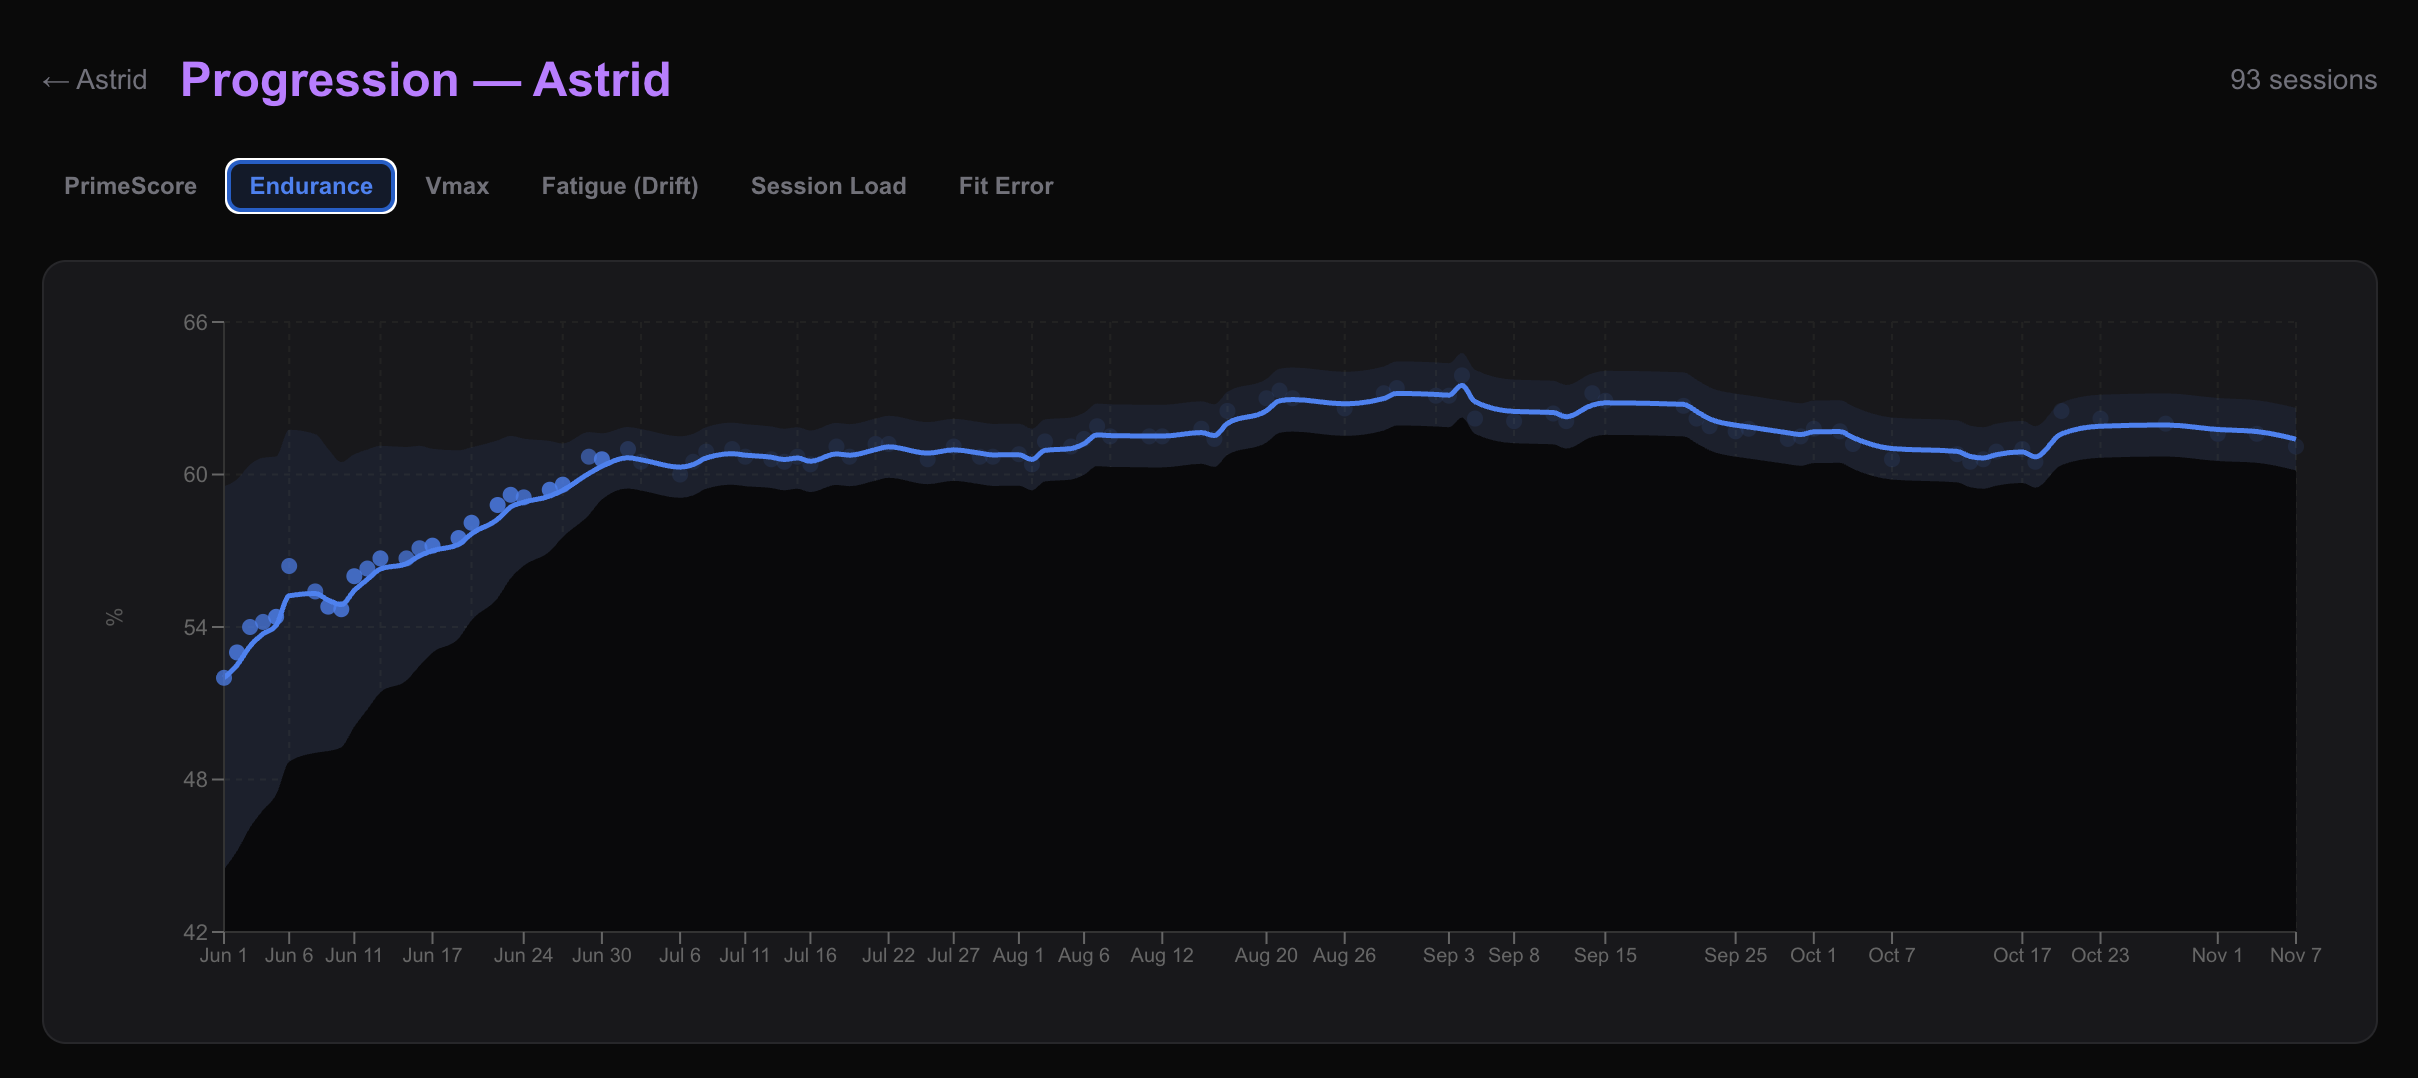
Fitness tracked across an entire season.
The trend line shows endurance (E) converging and then tracking real fitness changes across the season. The narrowing confidence band reflects the model's increasing certainty about the player's aerobic profile. Tabs provide access to PrimeScore, Vmax, fatigue, session load, and fit error.
f(E, V, P) → per-player profile
Add physiological profiling to your team platform.
TrueZone integrates with existing GPS/HR tracking systems. No new hardware, no calibration tests, no disruption to training workflows.